
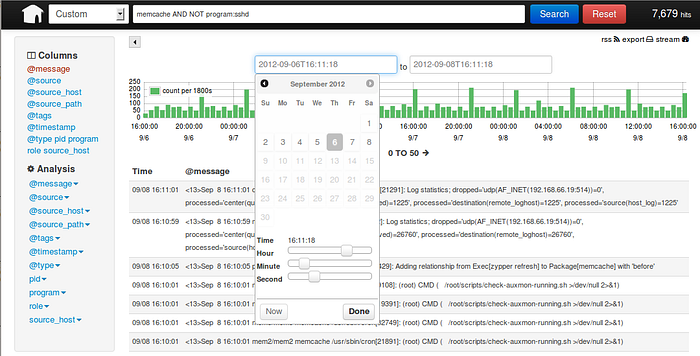
At Commando.io, we’ve always wanted a web interface to allow us to grep and filter through our nginx access logs in a friendly manner. After researching a bit, we decided to go with LogStash and use Kibana as the web front-end for ElasticSearch.
LogStash is a free and open source tool for managing events and logs. You can use it to collect logs, parse them, and store them for later.
First, let’s setup our centralized log server. This server will listen for events using Redis as a broker and send the events to ElasticSearch.
The following guide assumes that you are running CentOS 6.4 x64.
Centralized Log Server
cd $HOME
# Get ElasticSearch 0.9.1, add as a service, and autostart
sudo yum -y install java-1.7.0-openjdk
wget https://download.elasticsearch.org/elasticsearch/elasticsearch/elasticsearch-0.90.1.zip
unzip elasticsearch-0.90.1.zip
rm -rf elasticsearch-0.90.1.zip
mv elasticsearch-0.90.1 elasticsearch
sudo mv elasticsearch /usr/local/share
cd /usr/local/share
sudo chmod 755 elasticsearch
cd $HOME
curl -L http://github.com/elasticsearch/elasticsearch-servicewrapper/tarball/master | tar -xz
sudo mv *servicewrapper*/service /usr/local/share/elasticsearch/bin/
rm -Rf *servicewrapper*
sudo /usr/local/share/elasticsearch/bin/service/elasticsearch install
sudo service elasticsearch start
sudo chkconfig elasticsearch on
# Add the required prerequisite remi yum repository
sudo rpm —import http://rpms.famillecollet.com/RPM-GPG-KEY-remi
sudo rpm -Uvh http://rpms.famillecollet.com/enterprise/remi-release-6.rpm
sed -i ‘0,/enabled=0/s//enabled=1/’ /etc/yum.repos.d/remi.repo
# Install Redis and autostart
sudo yum -y install redis
sudo service redis start
sudo chkconfig redis on
# Install LogStash
wget http://logstash.objects.dreamhost.com/release/logstash-1.1.13-flatjar.jar
sudo mkdir —-parents /usr/local/bin/logstash
sudo mv logstash-1.1.13-flatjar.jar /usr/local/bin/logstash/logstash.jar
# Create LogStash configuration file
cd /etc
sudo touch logstash.conf
Use the following LogStash configuration for the centralized server:
# Contents of /etc/logstash.conf
input {
 redis {
 host => “127.0.0.1"
 port => 6379
 type => “redis-input”
 data_type => “list”
 key => “logstash”
 format => “json_event”
 }
}
output {
 elasticsearch {
 host => “127.0.0.1"
 }
}
Finally, let’s start LogStash on the centralized server:
/usr/bin/java -jar /usr/local/bin/logstash/logstash.jar agent —config /etc/logstash.conf -w 1
In production, you’ll most likely want to setup a service for LogStash instead of starting it manually each time. The following init.d service script should do the trick (it is what we use).
Woo Hoo, if you’ve made it this far, give yourself a big round of applause. Maybe grab a frosty adult beverage.
Now, let’s setup each nginx web server.
Nginx Servers
cd $HOME
# Install Java
sudo yum -y install java-1.7.0-openjdk
# Install LogStash
wget http://logstash.objects.dreamhost.com/release/logstash-1.1.13-flatjar.jar
sudo mkdir —-parents /usr/local/bin/logstash
sudo mv logstash-1.1.13-flatjar.jar /usr/local/bin/logstash/logstash.jar
# Create LogStash configuration file
cd /etc
sudo touch logstash.conf
Use the following LogStash configuration for each nginx server:
# Contents of /etc/logstash.conf
input {
 file {
 type => “nginx_access”
 path => [“/var/log/nginx/**”]
 exclude => [“*.gz”, “error.*”]
 discover_interval => 10
 }
}

filter {
 grok {
 type => nginx_access
 pattern => “%{COMBINEDAPACHELOG}”
 }
}

output {
 redis { host => “hostname-of-centralized-log-server” data_type => “list” key => “logstash” }
}
Start LogStash on each nginx server:
/usr/bin/java -jar /usr/local/bin/logstash/logstash.jar agent —config /etc/logstash.conf -w 2
Kibana - A Beautiful Web Interface
At this point, you’ve got your nginx web servers shipping their access logs to a centralized log server via Redis. The centralized log server is churning away, processing the events from Redis and storing them into ElasticSearch.
All that is left is to setup a web interface to interact with the data in ElasticSearch. The clear choice for this is Kibana. Even though LogStash comes with its own web interface, it is highly recommended to use Kibana instead. In-fact, the folks that maintain LogStash recommend Kibana and are going to be deprecating their web interface in the near future. Moral of the story… Use Kibana.
On your centralized log server, get and install Kibana.
cd $HOME
# Install Ruby
yum -y install ruby
# Install Kibana
wget https://github.com/rashidkpc/Kibana/archive/v0.2.0.zip
unzip v0.2.0
rm -rf v0.2.0
sudo mv Kibana-0.2.0 /srv/kibana
# Edit Kibana configuration file
cd /srv/kibana
sudo nano KibanaConfig.rb
# Set Elasticsearch = “localhost:9200"
sudo gem install bundler
sudo bundle install
# Start Kibana
ruby kibana.rb
Simply open up your browser and navigate to http://hostname-of-centralized-log-server:5601 and you should see the Kibana interface load right up.

Lastly, just like for ElasticSearch, you’ll probably want Kibana to run as a service and autostart. Again, here is our init.d service script that we use.
Congratulations, your now shipping your nginx access logs like a boss to ElasticSearch and using the Kibana web interface to grep and filter them.
Interested in automating this entire install ofElasticSearch, Redis,LogStash and Kibana on your infrastructure? We can help! Commando.io is a web based interface for managing servers and running remote executions over SSH. Request a beta invite today, and start managing servers easily online.


相关推荐
Filebeat实时收集Nginx日志说明之所以使用 beats 家族的 Filebeat 来替代 Logstash 是因为 Logstash实在太消耗资源了
7-logstash收集nginx访问日志-json.flv 8-logstash收集syslog日志.flv 9-logstash收集tcp日志.flv 10-logstash收集slowlog-grok.flv 11-logstash解耦之消息队列.flv 12-kibana实践.flv 13-elk上线流程.flv
而Nginx日志分割/GoAccess/Awstats都是相对简单的单节点解决方案,针对分布式集群或者数据量级较大时会显得心有余而力不足,而ELK的出现可以使我们从容面对新的挑战。 Logstash:负责日志的收集,处理和储存; ...
说明文档E-mail:Blog:======ELK集成: Awesant + Logstash + Elasticsearch +Kibana + Nginx + Redis======单机版(Standalone): Logstash-index(收集日志)+ Elasticsearch(索引)+ Kibana(前端) +Nginx...
而Nginx日志分割/GoAccess/Awstats都是相对简单的单节点解决方案,针对分布式集群或者数据量级较大时会显得心有余而力不足,而ELK的出现可以使我们从容面对新的挑战。Logstash:负责日志的收集,处理和储存Elastic...
模拟慢连接、DDOS、撞库、爆破等恶意攻击并统一数据格式,Logstash过滤收集有效日志,日志分类归档检索ES。日志量比较大,HDFS保存三天,快速响应,具有很好的 HA。针对各模块采取相应的分析算法,其中尤其关注敏感...
SpringCloud Eureka作为注册中心、Feign客户端调用工具、断路器Hystrix ...Nginx 日志管理插件工具使用lombok、分布式日志收集使用Logstash、解析JSON框架使用FastJson 数据安全加密使用MD5加盐和Base64、RSA、分布式...
概述 应用一旦容器化以后,需要考虑的就是如何采集位于Docker容器... Nginx镜像(作为容器化应用来生产日志) 开启Linux系统Rsyslog服务 修改Rsyslog服务配置文件: vim /etc/rsyslog.conf 开启下面三个参数: $ModLo
模拟慢连接、DDOS、撞库、爆破等恶意攻击并统一数据格式,Logstash过滤收集有效日志,日志分类归档检索ES。日志量比较大,HDFS保存三天,快速响应,具有很好的 HA。针对各模块采取相应的分析算法,其中尤其关注敏感...
Filebeat 收集日志 tar -zxvf filebeat-6.6.1-linux-x86_64.tar.gz -C /usr/local/elk cd /usr/local/elk/ mv filebeat-6.6.1-linux-x86_64 filebeat-6.6.1 cd filebeat-6.6.1 ## 修改配置文件 vim filebeat.yml ...
微信商城+微信公众号开发,该项目根据上海某大型知名电商企业...日志管理插件工具使用lombok、分布式日志收集使用Logstash、解析JSON框架使用FastJson 数据安全加密使用MD5加盐和Base64、RSA、分布式文件存储系统Fast
MySQL项目管理工具使用Maven、版本控制工具使用GIT、项目自动部署工具使用Jenkins消息中间件使用ActiveMQ、分布式任务调度系统使用XXLJOB、反向代理工具使用Nginx日志管理插件工具使用lombok、分布式日志收集使用...
基本信息 安装 一切都可以通过运行./make_dev或双击UNIX中的make_dev文件来完成。 用PHPSpec完成的单元... elk :使用Logstash收集日志,将其发送到Elasticsearch并使用Kibana可视化的容器。 redis :Redis服务器容
新增了一个FileBeat,它是一个轻量级的日志收集处理工具(Agent),Filebeat占用资源少,适合于在各个服务器上搜集日志后传输给Logstash,官方也推荐此工具。 Elasticsearch是个开源分布式搜索引擎,提供搜集、分析、...
从收集时间戳的日志,进行解析以过滤掉垃圾,对其进行索引并以可在中央位置搜索的方式标准化为JSON。 比单个计算机上的awk,grep等更好。 RabbitMQ在Logstash生产者和消费者之间排队服务,以通过吸收峰值来确保可...
java版商城源码下载 TryMall 该项目旨在学习mall电商项目 组织结构 mall ├── mall-common -- 工具类及通用代码 ...日志收集工具 Kibina 日志可视化查看工具 Nginx 静态资源服务器 Docker 应用容
该日志收集系统分两大块,即服务端与客户端: 服务端:即接受日志的服务器,日志在这里建立索引并在kibana呈现。 客户端:日志生产者 ELK整套系统在centOS上的安装分一下几个步骤: java Logstash Elasticsearch ...
Filebeat是本地文件的日志数据采集器,可监控日志目录或特定日志文件(tail file),并将它们...带有内部模块(auditd,Apache,Nginx,System和MySQL),可通过一个指定命令来简化通用日志格式的收集,解析和可视化。
开发环境:JDK 1.8Mysql 5.7Redis 5.0MongoDB 4.2.5RabbitMQ 3.7.14Nginx 1.10Elasticsearch 7.6.2Logstash 7.6.2Kibana 7.6.2搭建步骤:1、Windows环境部署Windows环境搭建请参考:mall在Windows环境下的部署;...